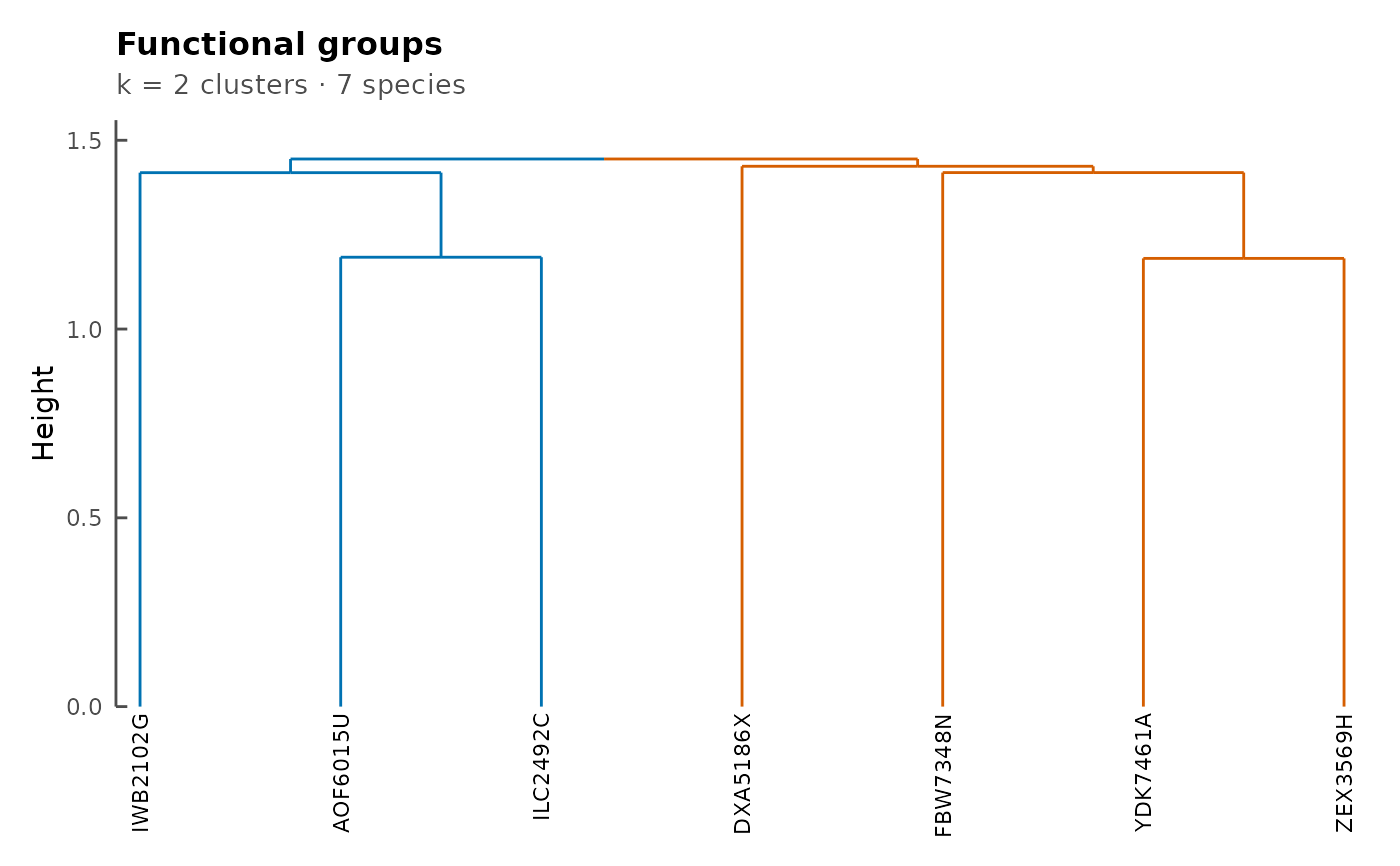
Visualizes the functional groups dendrogram computed by
functionalGroups. Branches are colored by
cluster membership and species labels are placed below
the dendrogram.
Arguments
- fg
A list as returned by
functionalGroups, containing at least adendrogramelement.- k
Integer scalar specifying the number of clusters to color in the dendrogram. Default
4.- label_size
Numeric scalar specifying the text size for species labels. Default
3.- label_colours
If not
NULL, a data frame with columnslabelandcolourmapping species names to colors. WhenNULL(default), all labels are drawn in black.
See also
functionalGroups for computing
the functional groups data.
Examples
cm1 <- synCM("comm_1", n_species = 3, max_met = 5)
cm2 <- synCM("comm_2", n_species = 4, max_met = 6)
cms <- ConsortiumMetabolismSet(
    cm1, cm2, name = "test"
)
#>
#> ── Creating CMS "test" ─────────────────────────────────────────────────────────
#> ℹ Validating 2 <ConsortiumMetabolism> objects
#> ✔ Validating 2 <ConsortiumMetabolism> objects [11ms]
#>
#> ℹ Collecting metabolites from 2 consortia
#> ✔ Collecting metabolites from 2 consortia [30ms]
#>
#> ℹ Re-indexing 7 unique metabolites
#> ✔ Re-indexing 7 unique metabolites [26ms]
#>
#> ℹ Expanding 2 binary matrices to 7-dimensional space
#> ✔ Expanding 2 binary matrices to 7-dimensional space [23ms]
#>
#> ℹ Computing 7 x 7 levels matrix
#> ✔ Computing 7 x 7 levels matrix [24ms]
#>
#> ℹ Computing pairwise overlap (1 pairs via crossprod)
#> ✔ Computing pairwise overlap (1 pairs via crossprod) [22ms]
#>
#> ℹ Assembling pathway data from 2 consortia
#> ✔ Assembling pathway data from 2 consortia [30ms]
#>
#> ℹ Building dendrogram from 2 x 2 dissimilarity matrix
#> ✔ Building dendrogram from 2 x 2 dissimilarity matrix [21ms]
#>
#> ℹ Extracting dendrogram node positions
#> ✔ Extracting dendrogram node positions [24ms]
#>
#> ℹ Collecting 2 consortium graphs
#> CMS "test" created: 2 consortia, 7 metabolites (0.2s)
#> ✔ Collecting 2 consortium graphs [93ms]
#>
fg <- functionalGroups(cms)
plotFunctionalGroups(fg, k = 2)