Plot a ConsortiumMetabolismAlignment object
Source:R/methods-plot.R
plot-ConsortiumMetabolismAlignment-ANY-method.RdPlot a ConsortiumMetabolismAlignment object
Usage
# S4 method for class 'ConsortiumMetabolismAlignment,ANY'
plot(x, type = NULL, ...)
Arguments
- x
A
ConsortiumMetabolismAlignmentobject.- type
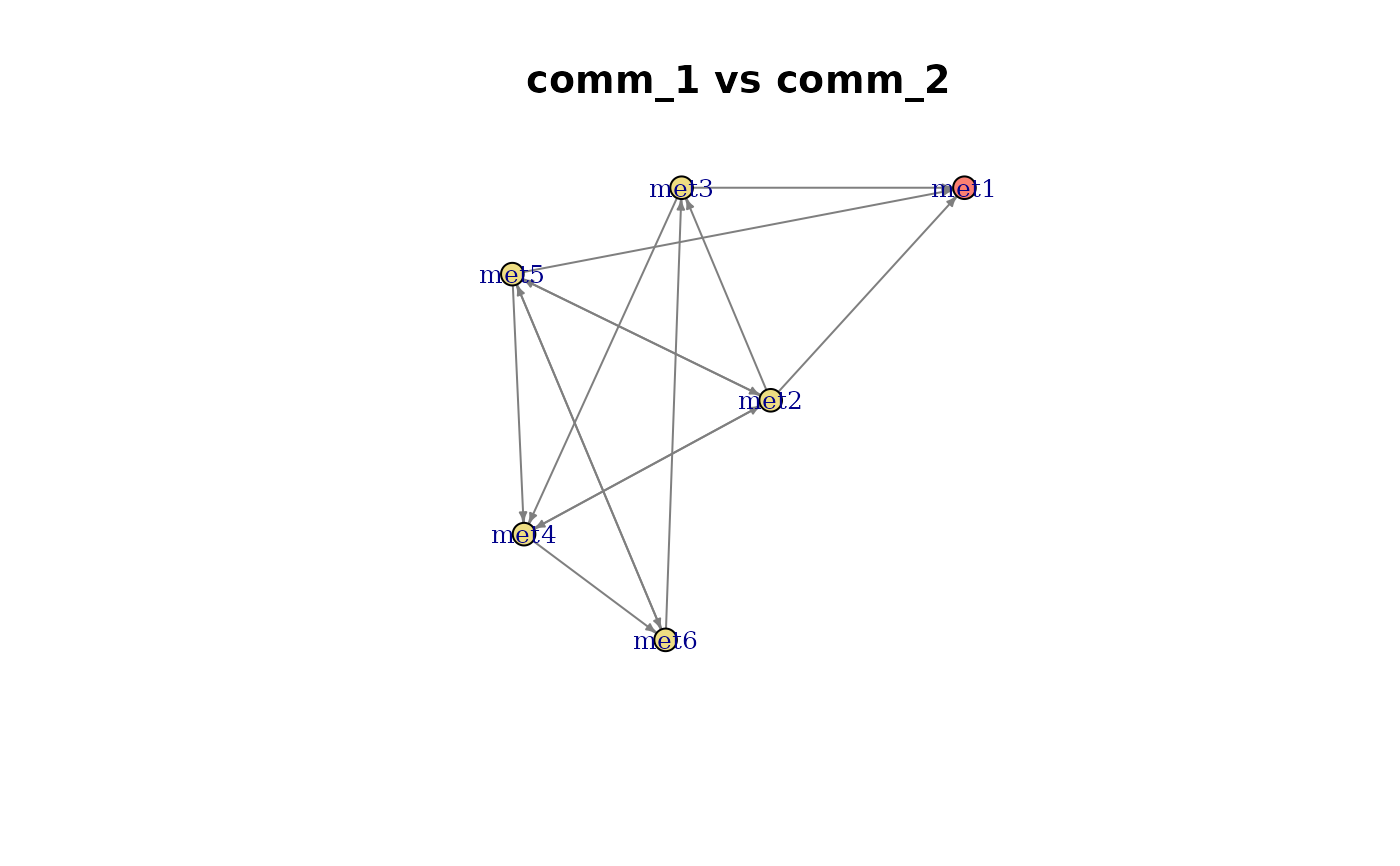
Character specifying the plot type:
"heatmap","network", or"scores".- ...
Extra arguments forwarded to the underlying plot helper. For
type = "network", the most useful areedgeColourValues(named character vector mappingshared,query,referenceto colours; defaults emphasise the shared edges with solid black against light/dark grey) andnodeColourValues(override the node role palette).