Render a single assay of a ConsortiumMetabolism as a
directed metabolite-to-metabolite flow network. Each edge is a
pathway (consumed metabolite \(\rightarrow\) produced
metabolite); the chosen type determines what the edge
weight encodes.
Arguments
- x
A
ConsortiumMetabolismobject.- type
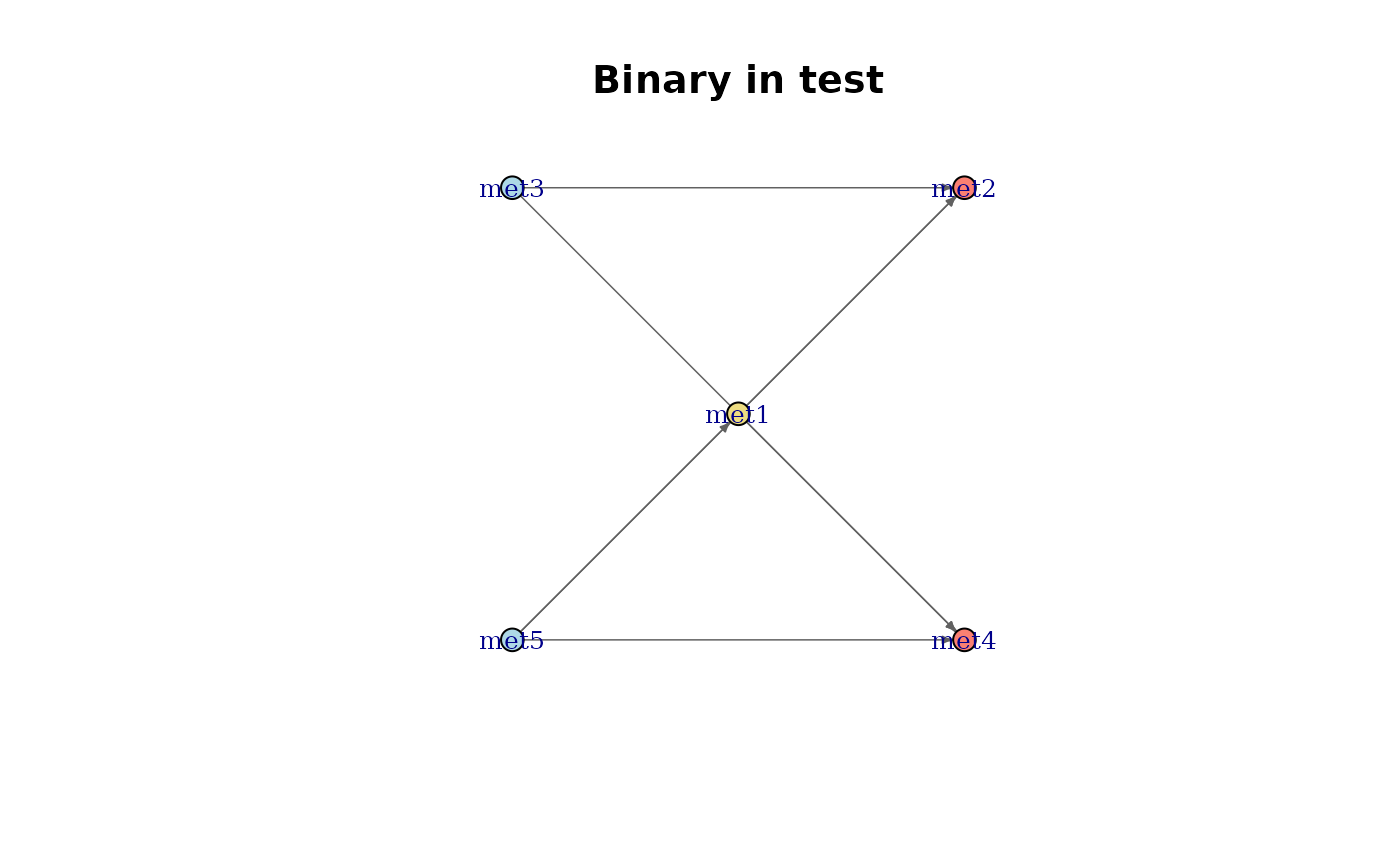
Character. Which of the eight CM assays to render. One of:
"Binary"Presence / absence of each pathway (consumed \(\rightarrow\) produced).
"nSpecies"Count of species that participate in each pathway.
"Consumption"Total consumption flux per pathway (sum of uptake fluxes).
"Production"Total production flux per pathway (sum of secretion fluxes).
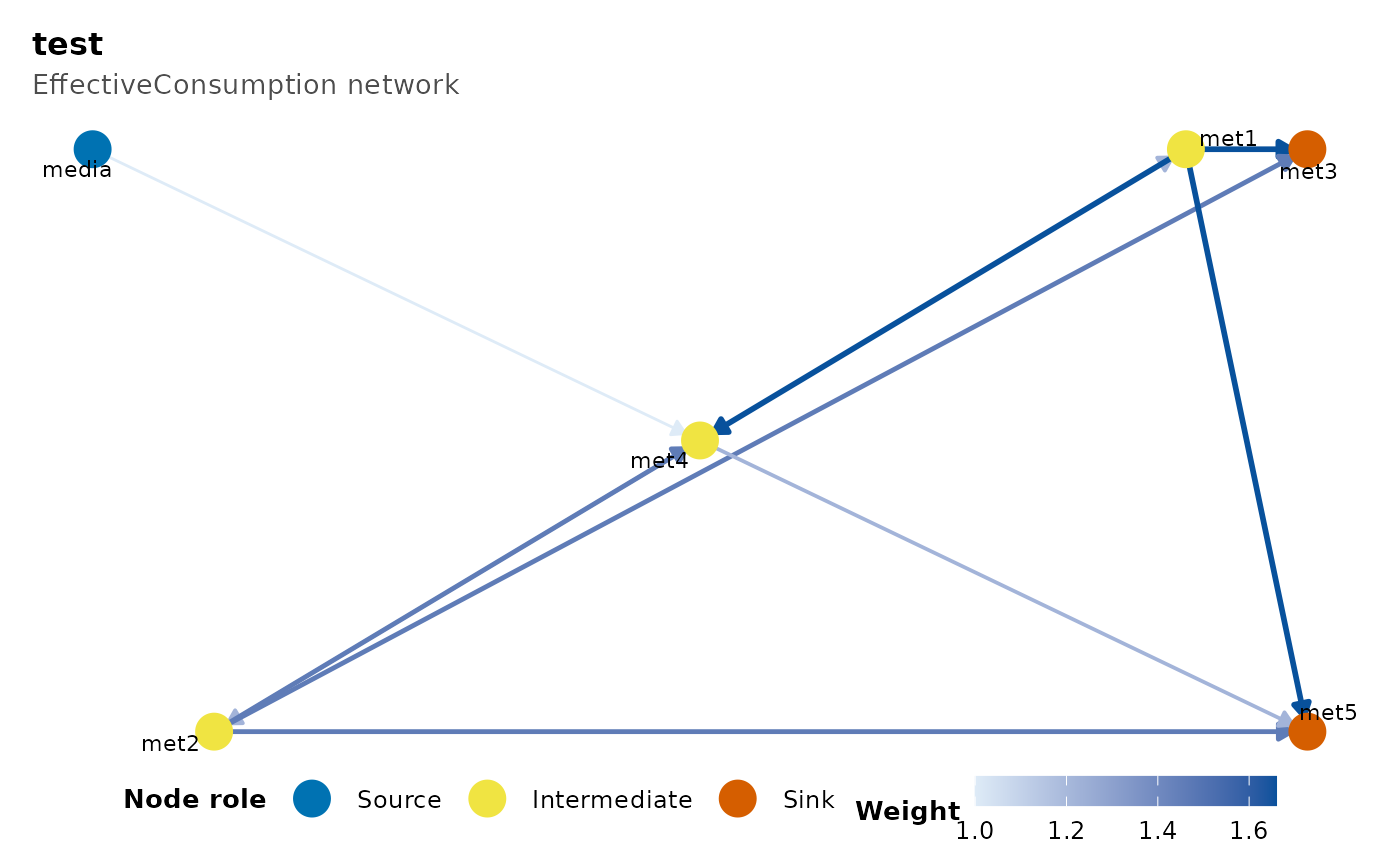
"EffectiveConsumption"Consumption flux scaled by Hill-1 perplexity, \(F \cdot 2^{H(p)}\); same units as
Consumptionbut combines magnitude with species evenness across the pathway."EffectiveProduction"As above on the production side.
"nEffectiveSpeciesConsumption"Hill-1 effective number of consuming species. Unitless, in \([1, S]\).
"nEffectiveSpeciesProduction"As above on the production side.